Compare the drafts
Three maps, four questions.
Who moves? How many children change buildings? How full does each school get? Who stays together into middle school? The answers point to different drafts, which is why the final map deserves a careful read.
Question 1
Who moves?
The new school was planned to relieve Farragut Primary and Intermediate, so splitting today's Farragut zone among three Farragut campuses is expected under any map. The open question is how far each draft reaches into the neighboring school communities.
Our estimate Residential addresses from county GIS inside our reconstructions of the KCS maps. Apartment units count once each. Student figures spread each zone's current enrollment across its homes by housing type. They describe today's students on the new lines. They are not district counts or projections. Method
Question 2
How many children change buildings?
Three things put a child in a different building. Two were settled when the school was approved: Farragut students filling the new school, and Farragut's switch from a K-2 and a 3-5 school to K-5 schools. Only the first row is a boundary decision that is still open.
Our estimate Today's K-5 students, rounded to the nearest 10. The range combines two estimating methods and a 10% margin. The fall 2027 rows assume equal grade sizes. At Farragut, rising third graders already change buildings today, so the building-switch row overstates the disruption caused by rezoning alone. New kindergarteners are not counted. Rising fifth graders may apply for a one-time transfer to stay, with families providing transportation. KCS transfer terms, p. 35
Question 3
How full does each school get?
KCS plans around 80% of each building's seats, to leave room for growth. These are the district's own projections for each draft.
KCS Enrollment projections and programmatic capacity from the district presentation, pp. 14, 19 and 25. KCS published projections only for schools whose zones change in a given draft, so there is no single table that shows every school in every year under every option, including today's lines. That table is one of the things families are asking for.
Question 4
Who stays together into middle school?
Middle school lines are not changing. So the elementary map decides which classmates reach sixth grade together.
Our estimate Each ribbon is the homes in one elementary zone that feed one middle school, using county middle school zones. The share is averaged over the same 40,981 addresses in every map. It uses addresses, not enrolled children, friendships or transfers. Method · KCS on feeder alignment, p. 12
What this means for the Choto area
Choto-area homes are zoned for Northshore Elementary today but already feed Farragut Middle and Farragut High. Moving them to the new school puts those children with their future middle school classmates sooner. It also takes them away from their current Northshore classmates. Both are real.
A closer look
Scenario 2 moves three groups of children to relieve one school.
Scenarios 1 and 2 both relieve Hardin Valley. Scenario 1 does it with one move. Scenario 2 does it with three, and only the first of them takes a child out of Hardin Valley.
Scenario 1one move
Scenario 2three moves
The Northshore swap
Scenario 2 moves 3,015 Northshore addresses to the new school and 2,060 Farragut addresses into Northshore. That is 5,075 homes changing schools to shrink Northshore's zone by 955, at a school that is 72% full. It is also the only draft that moves families now zoned for Farragut out of the Farragut elementary schools.
To be fair
Scenario 2 gives Hardin Valley the most relief on opening day: 761 students in 2027, 75% of its seats, against 85% under Scenario 1. If opening-year relief for Hardin Valley is the top priority, that is its case. The question for the board is whether 61 seats of difference by 2030 justifies the two extra moves.
KCS Enrollment projections and seats: presentation, pp. 14 and 19. Our estimate Students in each move and address counts, from county address data on our reconstruction of the draft maps. KCS has not published how many enrolled children each move affects. That the three moves depend on each other is our reading of the map, not a district statement. Method
Putting it together
Different priorities pick different drafts.
We scored the drafts on seven outcomes. Change how much each outcome matters and the leader changes. No draft wins on everything.
| If you care most about | Scenario 1 | Scenario 2 | Scenario 3 |
|---|---|---|---|
| A balanced starting mixmoves, classmates, portables, roads, growth | 56.6 | 21.3 | 47.5 |
| Classmates and portablesmiddle school continuity and A.L. Lotts classrooms | 40.2 | 16.3 | 64.4 |
| Hardin Valley and room to the eastopening-year relief and 2030 space at Northshore | 51.4 | 62.6 | 27.8 |
Our model Points out of 100. The weights are a community starting point, not a district score. Set your own weights · Inputs and method
Community option for KCS to test
Could smaller boundary changes relieve two schools?
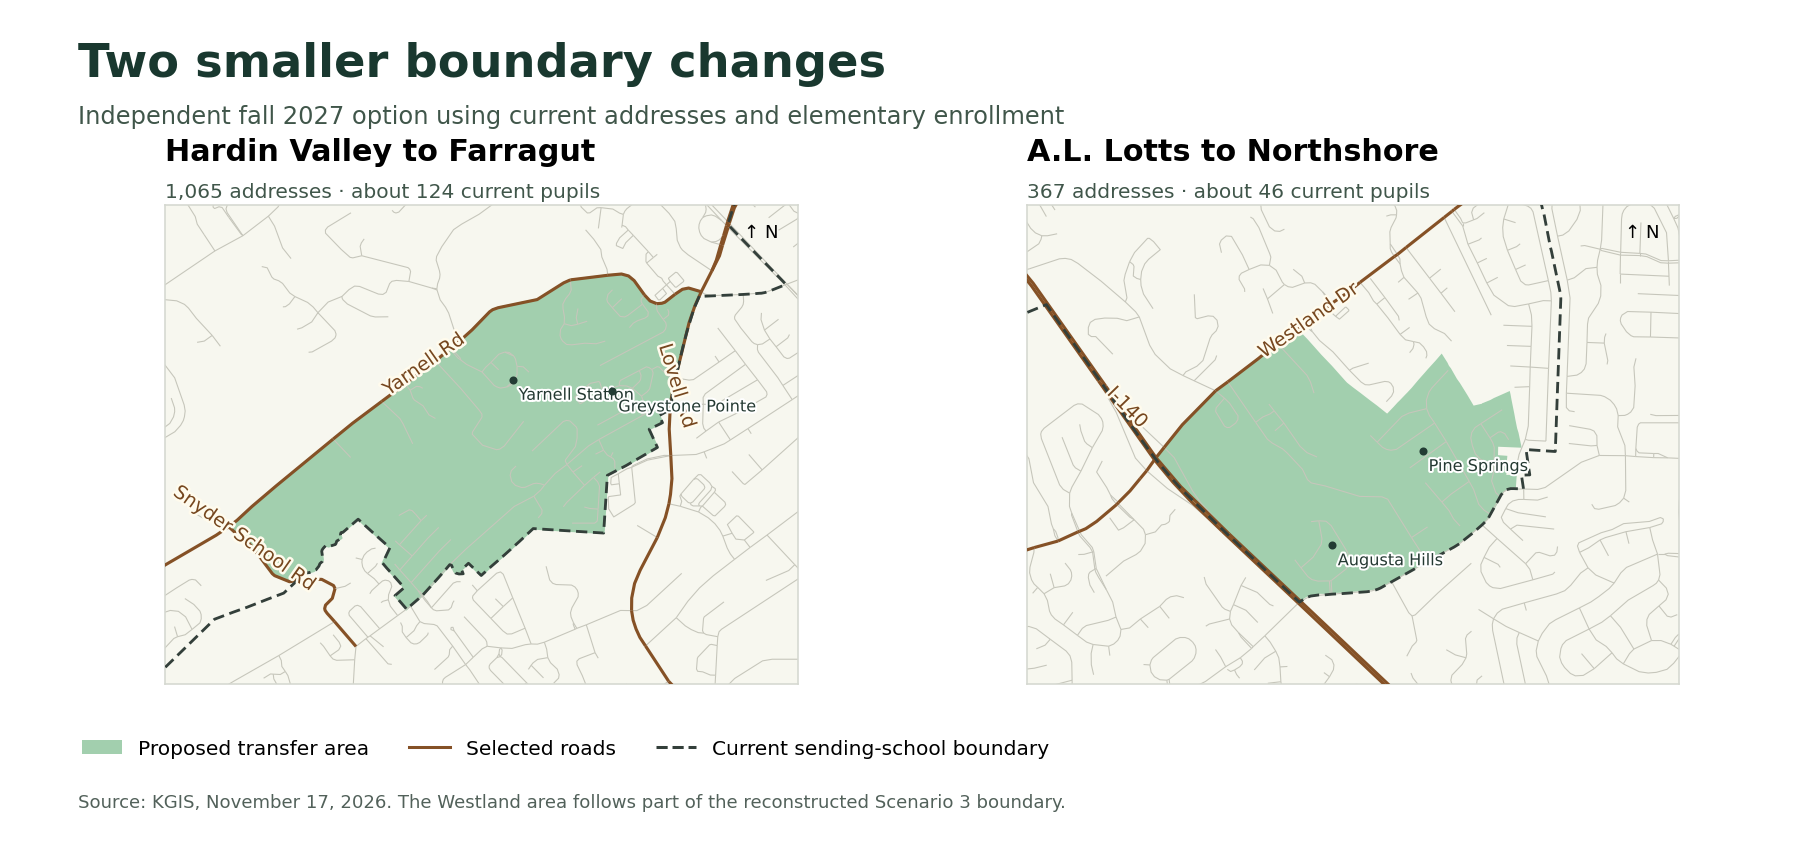
This community alternative would extend the Farragut zone to part of Hardin Valley and move a smaller group from A.L. Lotts to Northshore. Choto stays at Northshore. Some Farragut students would still change buildings as the schools convert to K-5.
Hardin Valley to Farragut Primary
The shorter Yarnell boundary covers 1,065 addresses, including Yarnell Station and Greystone Pointe. We estimate 124 current students would attend the converted Farragut Primary campus. All the addresses already feed Hardin Valley Middle.
At today’s counts, that would take Hardin Valley from 934 to about 810 students in 1,016 seats, just below the district’s 80% planning level. Using regional student-per-home rates gives a smaller move of 112 students and leaves Hardin Valley just above that level.
A.L. Lotts to Northshore
Use the portion of the Scenario 3 Lotts move south of Westland Drive, including Pine Springs and Augusta Hills. It covers 367 addresses and an estimated 46 current students. The full Scenario 3 move covers 1,902 addresses.
At today’s counts, Lotts would go from 838 to about 792 students in 996 seats. Northshore would reach about 75% of its 1,348 seats with Choto staying. The modeled drive to Northshore is about three minutes longer at the median. KCS would need to show which classes could leave portables.
Check the receiving classrooms before adopting a line
With Scenario 1’s internal Farragut lines, adding the Yarnell group would put Primary at about 757 of 900 seats (84%) at today’s enrollment. One adjustment to test would place Sweet Briar and The Cove at Turkey Creek together at Intermediate. Our estimate then puts Primary at 717 and Intermediate at 639, each in 900 seats. Those families would have longer modeled drives than under the original Primary assignment.
These are independent estimates using current students. KCS has published 2027 and 2030 projections for its three drafts. It has yet to publish projections for this combination. KCS capacity, slide 14 · Lotts and Northshore, slide 25.
What would families need to know about this alternative?
The address estimates show how many children might move. Enrolled students by street and grade, available staffed classrooms and the classes still in portables would show whether the smaller change delivers enough relief. An annual comparison of actual enrollment with the forecast could help families judge when another review might be needed.
A later change along Kingston Pike or Northshore Drive could involve other school communities. Staff discussed the possible reach of that review at Bearden. Hear the corridor question, 1:43:06.